Best reporting tools for explaining AI visibility work
Compare AgencyAnalytics, Whatagraph, DashThis and manual reports for explaining AI visibility, completed work and business outcomes with clear evidence.
Choose AgencyAnalytics when an agency wants client reporting alongside its own AI Tracker. Evaluate Whatagraph when the main challenge is bringing several marketing data sources into a governed reporting workflow. Consider DashThis for straightforward client dashboards and custom data inputs. Use a manual report when the evidence still needs more explanation than automation.
The most useful report separates three things: what was observed in AI answers, what work was completed, and what happened in the business. Putting those numbers on one page does not prove that one caused another.
Which reporting approach fits the account?
Choose around the evidence you need to preserve and the questions the client asks.
| Approach | Strongest starting fit | What to inspect | Main tradeoff |
|---|---|---|---|
| AgencyAnalytics | Agencies wanting reporting and native AI tracking | Prompt scope, historical answers and client presentation | Its measurement method may differ from another visibility tool |
| Whatagraph | Reporting across several data sources | Source connections, transformations and governance | Blended data can lose context if mappings are weak |
| DashThis | Clear recurring marketing dashboards | Custom inputs, commentary and table support | Manual inputs require a reliable refresh process |
| Manual report | A small account or an evolving methodology | Evidence links and concise explanation | Repeated assembly takes time and invites copy errors |
Disclosure: Parse is a related product from our team.
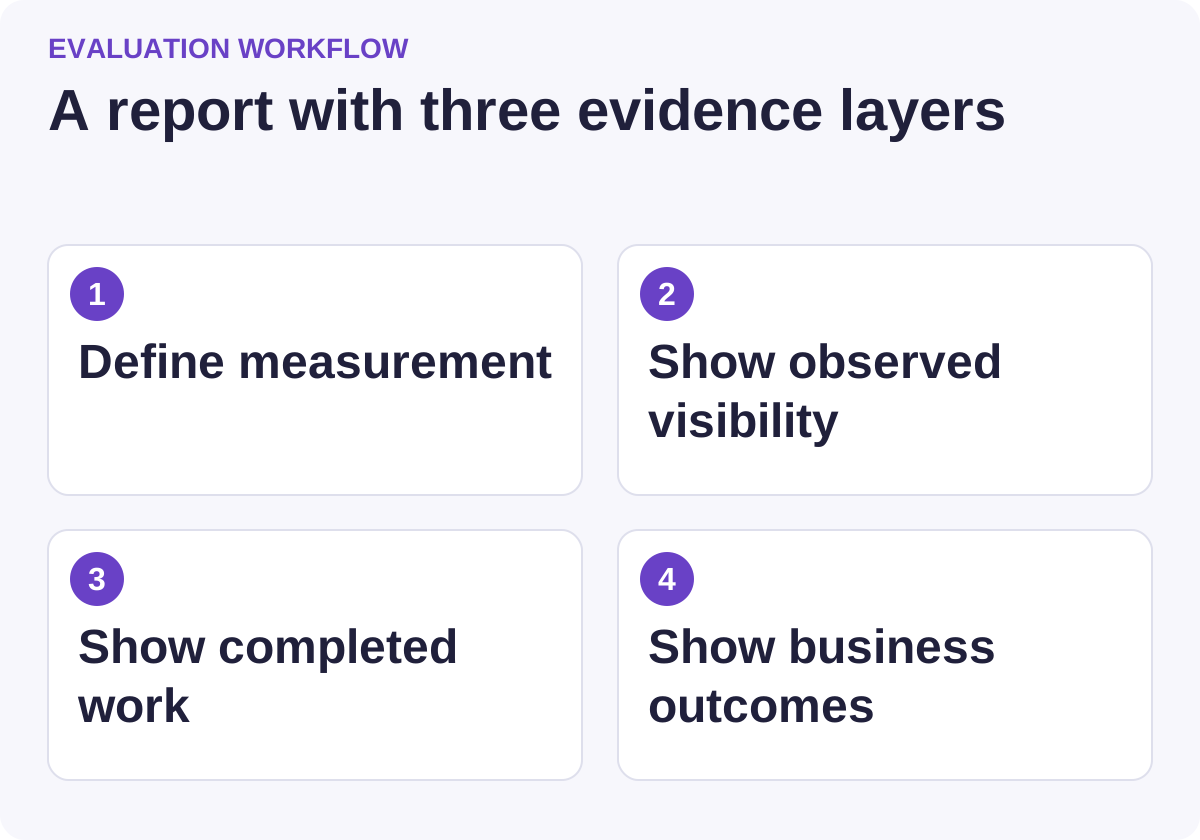
Use this workflow to compare candidates against the same requirements.
AgencyAnalytics: evaluate the tracker and the report together
AgencyAnalytics offers agency reporting with integrations, dashboards and an AI Tracker. It is therefore partly a measurement alternative, not simply a neutral presentation layer for another product's data.
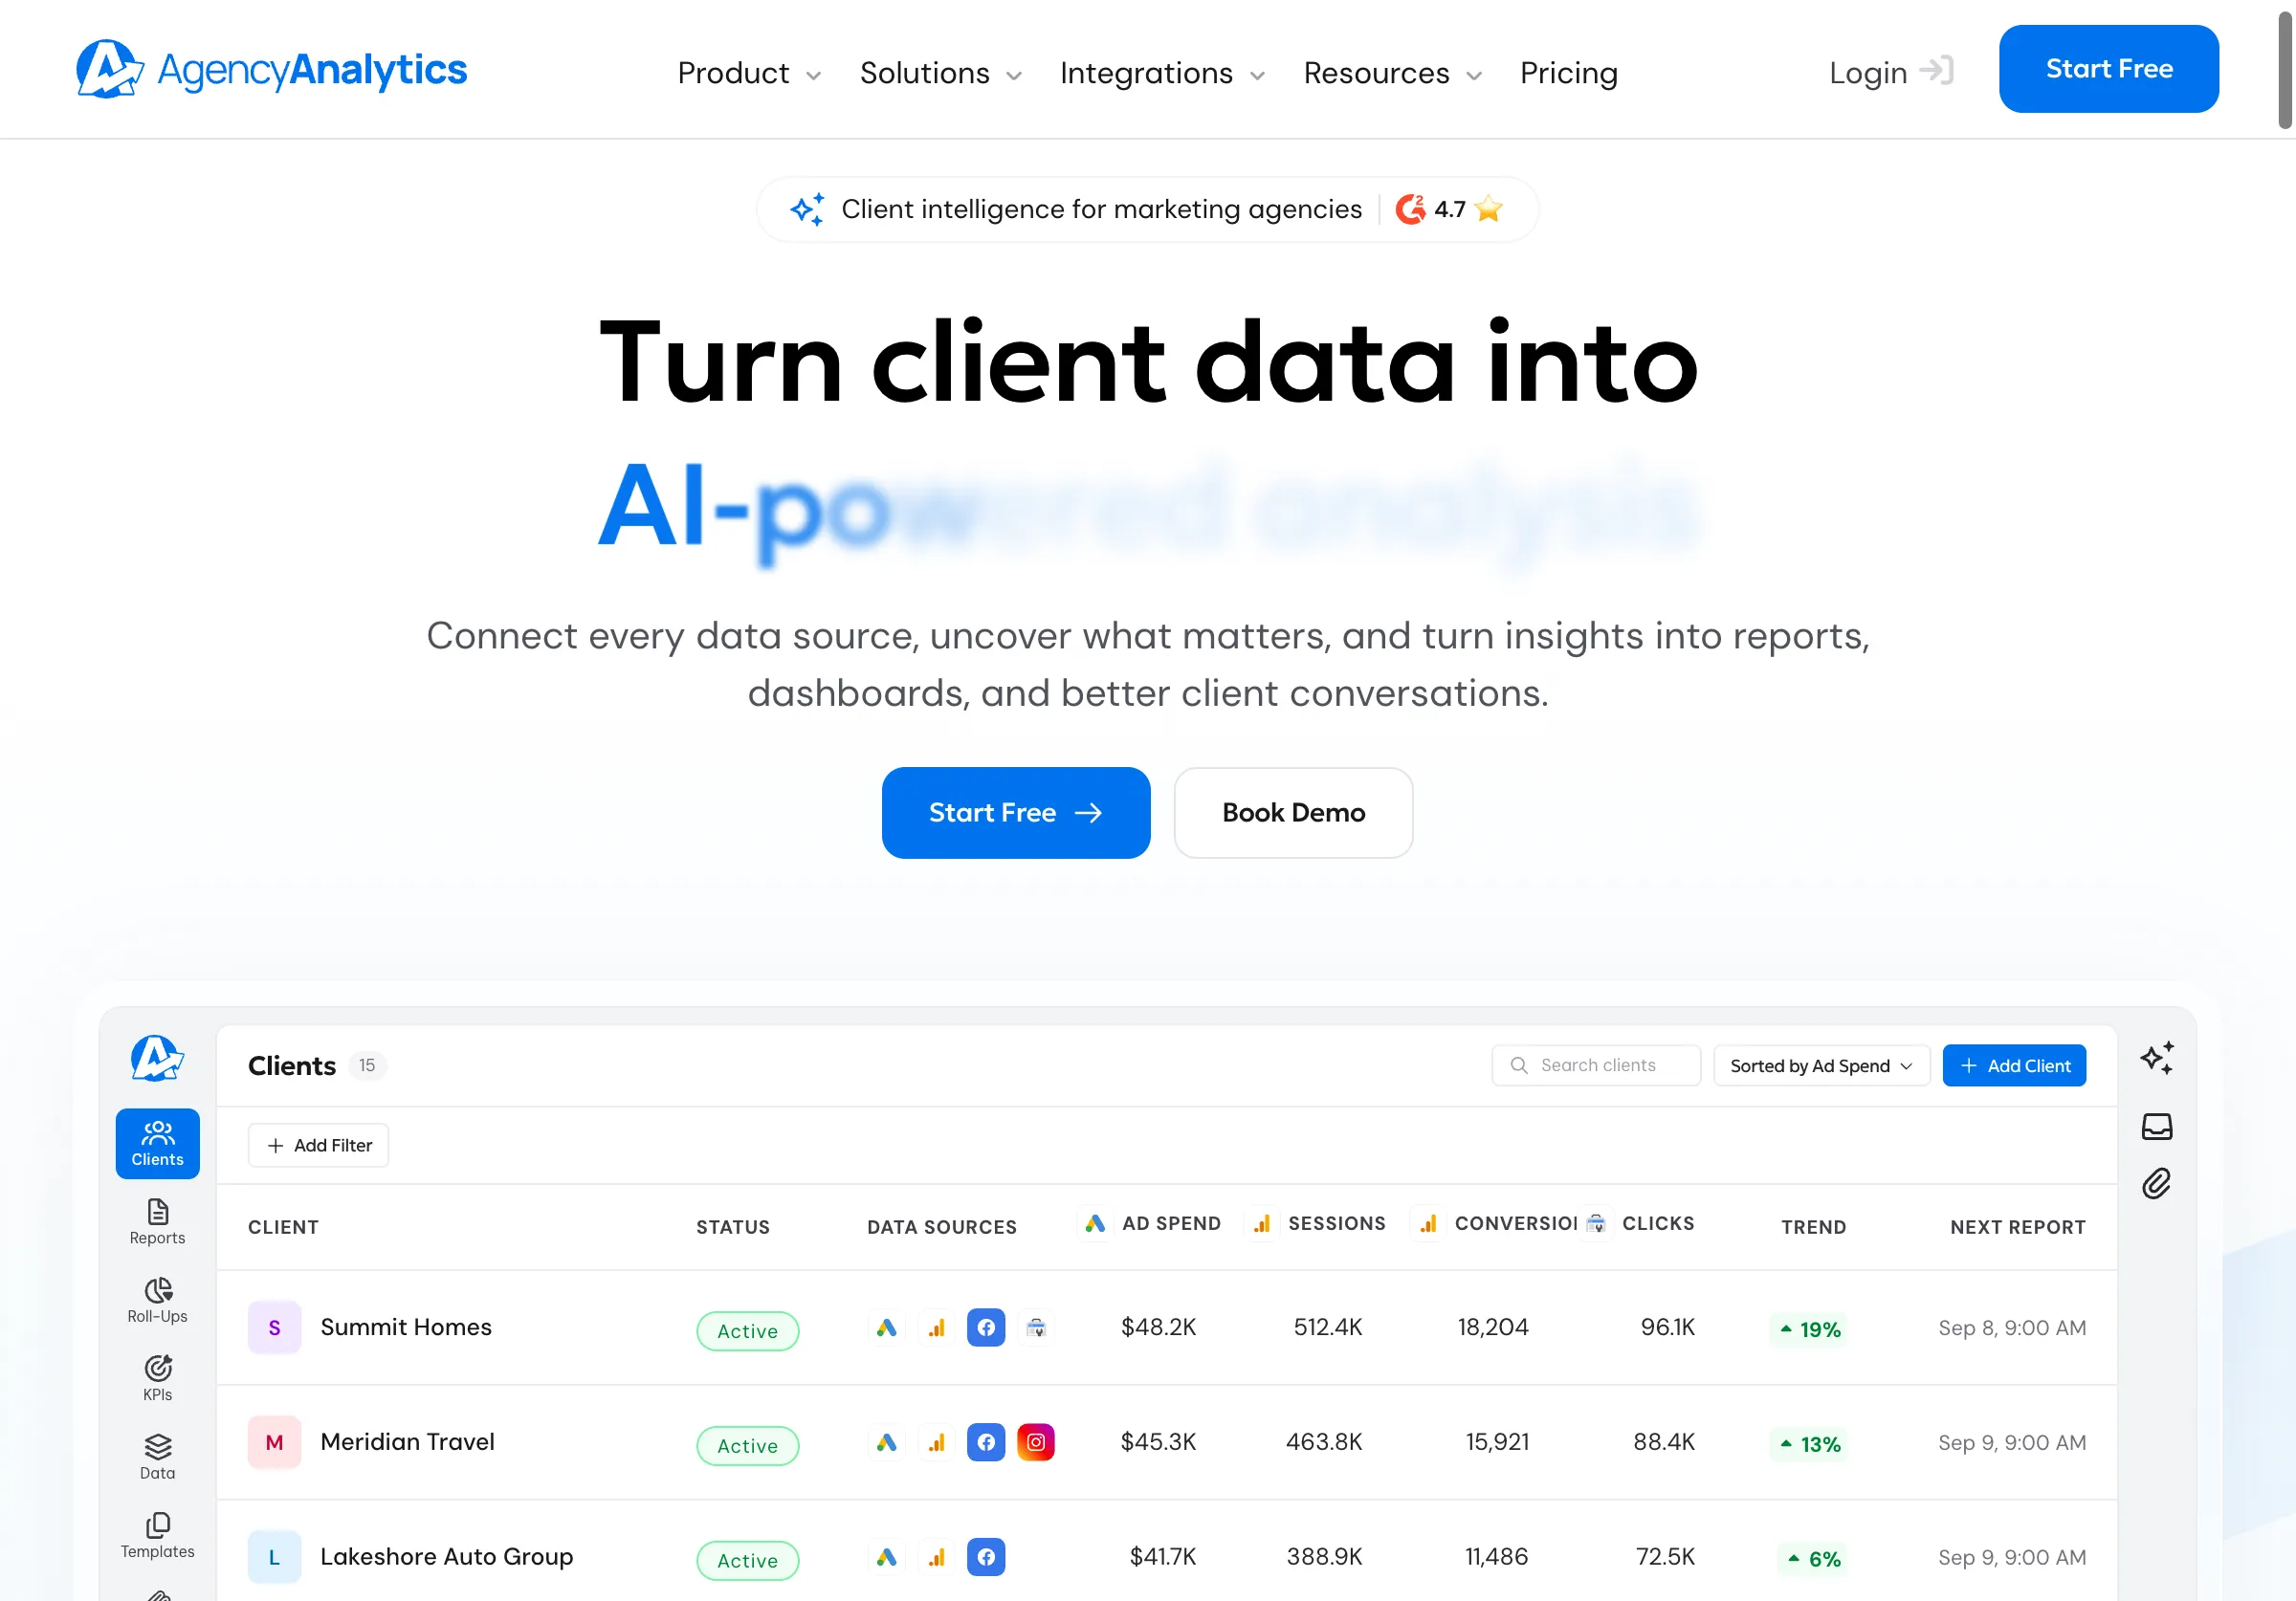
Public source page, captured November 2, 2026.
Its AI Tracker documentation describes tracked prompts, locations, topics and historical responses. It also explains a headless, API-based collection approach and why results can differ from an individual's ad hoc session.
Choose it when that integrated workflow meets your client's requirements. Do not combine its percentages with another provider's results without checking prompt sets, platforms, collection methods and denominators.
The same documentation distinguishes tracked prompts from its Opportunities beta. The latter has its own platform and geographic scope, and finding opportunities is different from adding them to paid tracking. Preserve those distinctions in a client explanation.
During a trial, ask a colleague to trace one reported change back to the actual historical answer. If the report cannot explain what was measured, the convenience of an all-in-one dashboard is less valuable.
Whatagraph: evaluate data handling before the visual design
Whatagraph presents cross-channel reporting and a governed marketing-data layer. That makes it a useful candidate when the account already has several reporting sources and the team needs consistent transformations and presentation.
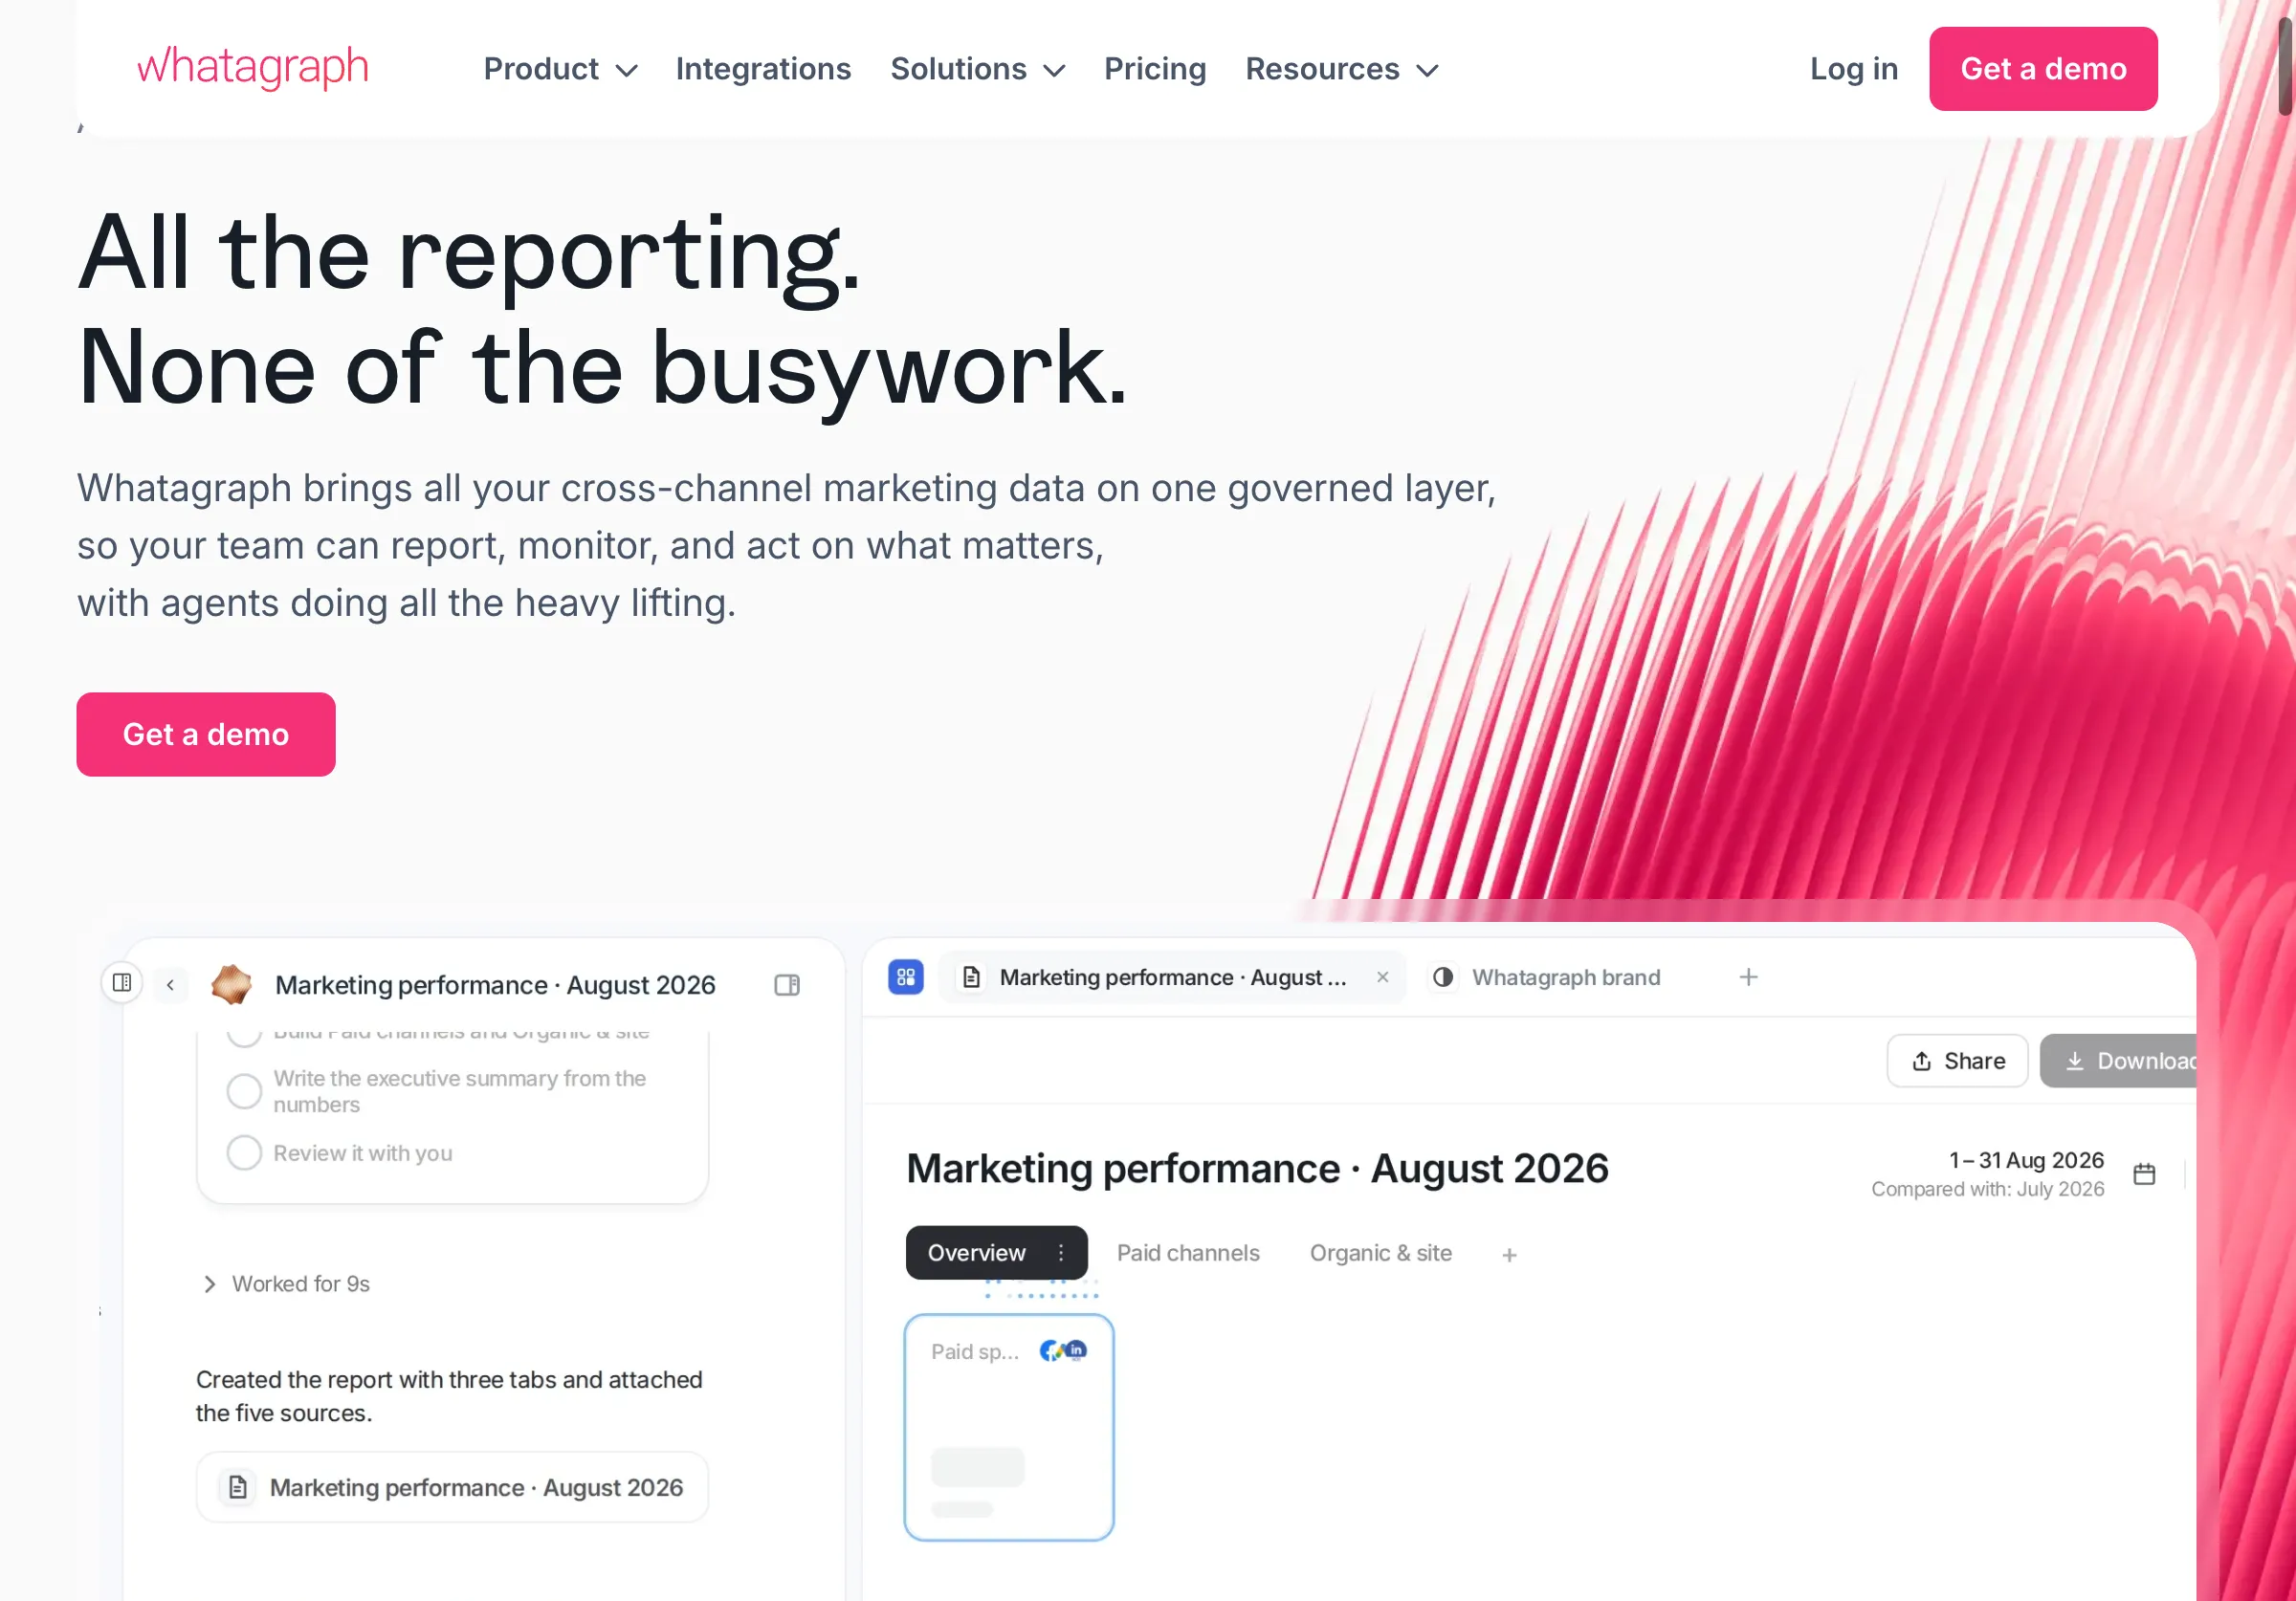
Public source page, captured November 2, 2026.
Choose it when the data workflow is the main bottleneck. Do not assume a connector exists for every visibility product or that a numerical import preserves the underlying answer evidence.
Its source-management guide describes connecting and managing sources. Its report-source guide notes that sources belong to Spaces, which affects their availability in reports.
In a trial, confirm the exact route for your visibility data: native integration, supported custom input or a separate linked evidence appendix. Check dates, time zones and missing values before designing a polished chart. A blank collection result should not silently become zero visibility.
DashThis: evaluate a simple report with explicit custom inputs
DashThis focuses on marketing dashboards and client reporting. Its custom-data guide describes manually editable widgets, CSV tables and configured CSV data sources. Its table-widget guide explains displaying uploaded data as a table.
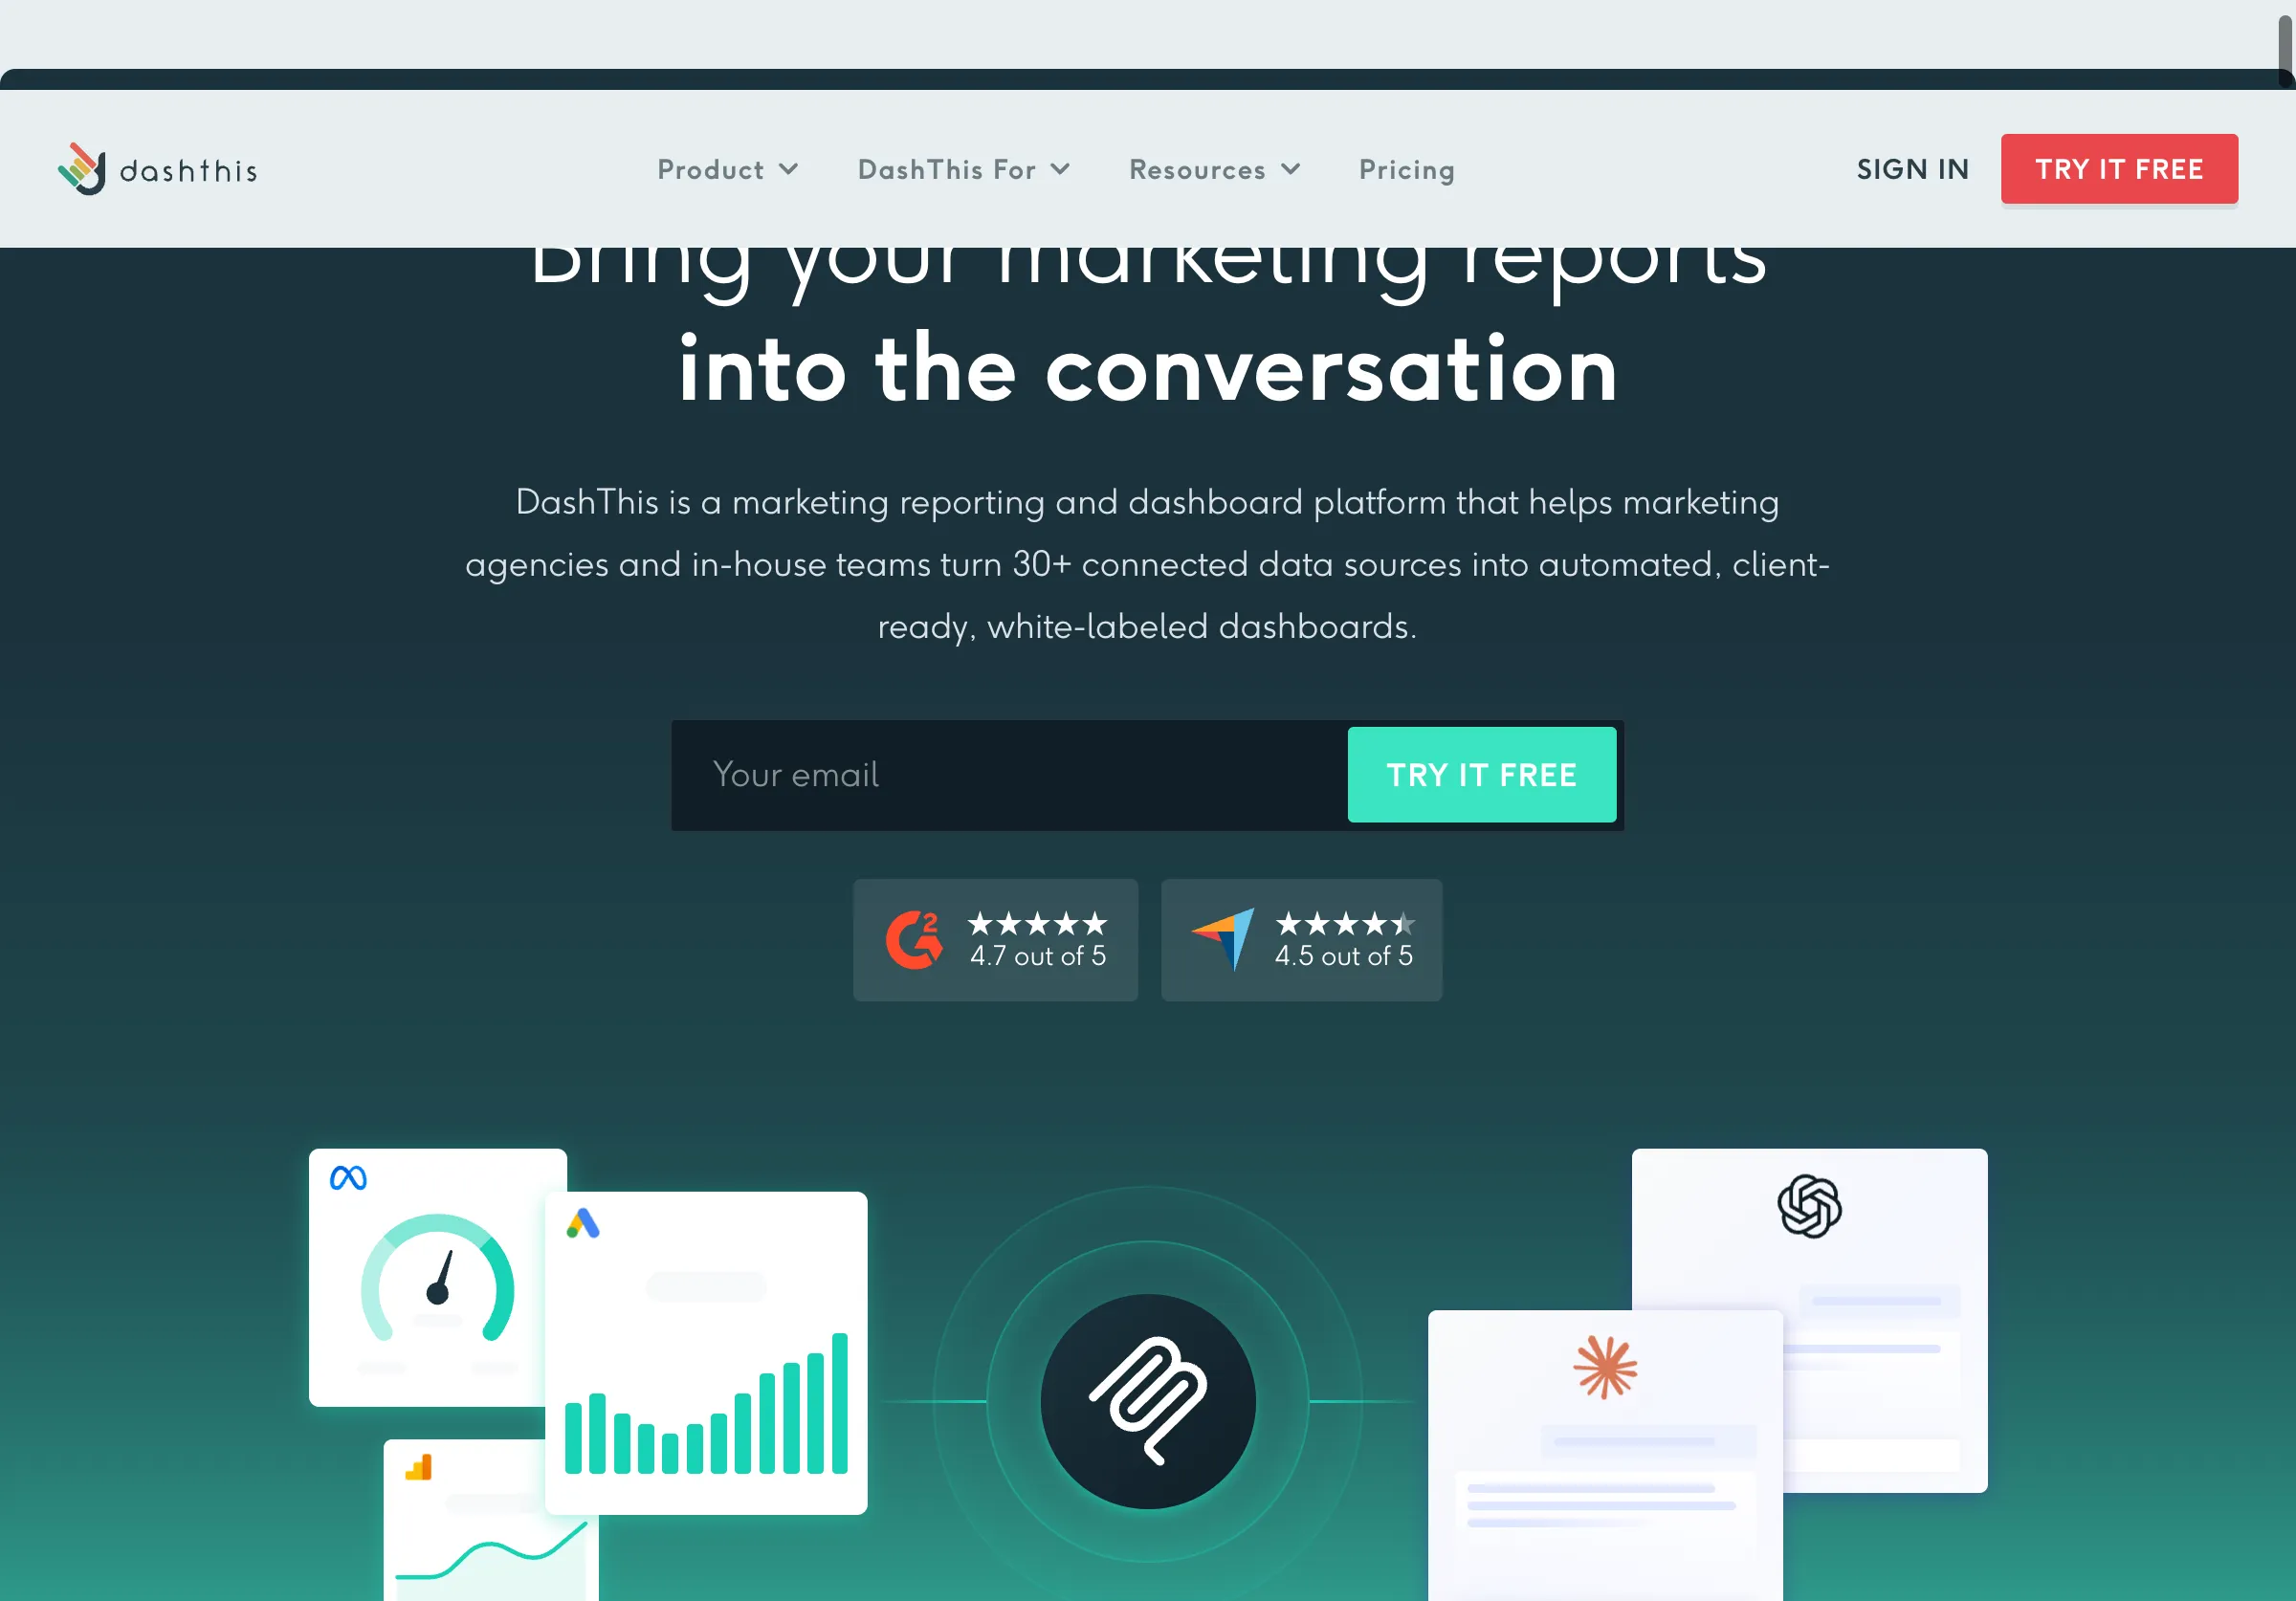
Public source page, captured November 2, 2026.
Choose it when a concise recurring dashboard meets the client need and the custom-input workflow is manageable. Do not treat an uploaded table as a live integration. Someone must own the refresh and validate the data.
For the trial, include a small evidence table with question, platform, observation date, outcome and a source link. Inspect whether the shared and exported report preserve the links and explanatory notes. Confirm that viewers can tell when each data source was last updated.
Simple reporting can be an advantage. The test is whether the client understands the result and its limits without a long walkthrough, not whether every metric can be placed in a widget.
A manual report can be the right first version
Choose a document or presentation when the methodology is still changing or the account has only a few consequential findings. A short narrative with evidence can be clearer than an automated dashboard assembled before the team agrees on definitions.
Do not let manual reporting become an untracked collection of copied numbers. Keep a source table, calculation notes and a final review checklist. Reuse the structure while refreshing the evidence deliberately.
A practical report can fit into five sections: the question, the observation, the work completed, the business signal and the next decision. Each section should state its own date range and limitations.
Automate after several reporting cycles reveal which fields and calculations remain stable. That reduces the risk of encoding a confusing methodology into a permanent dashboard.
Build an evidence contract before building charts
For every metric, define the unit, denominator, collection scope and source. “Mention rate” needs an explanation of which questions, platforms, dates and successful observations were included. A change in the prompt set can change the result without any change in the business's actual standing.
Keep collection failures separate from answers that did not mention the brand. Record whether a result is missing, failed, excluded or successfully observed. These categories should not collapse into one zero.
For completed work, link to the actual deliverable: a corrected page, published article or verified technical fix. A draft or submitted update should not appear as a published result.
For business outcomes, use the appropriate analytics or CRM source and retain its attribution limits. A lead that self-reports an AI tool and a session with an identifiable AI referrer are different observations.
Test the report with one illustrative account
Use fictional records to evaluate the reporting workflow before connecting a client. The fixture should include success, uncertainty and unfinished work.
| Record | How it should appear |
|---|---|
| Successful answer that mentions the brand | Included in the defined visibility calculation |
| Successful answer without a mention | Included as a non-mention |
| Failed collection | Shown as missing or failed, not a non-mention |
| Article drafted but not published | Work in progress |
| Page corrected and checked live | Completed work with evidence |
| AI-referral session with a conversion | Analytics observation with its attribution scope |
| Customer recalls using AI | Self-reported evidence, separately labeled |
Ask someone unfamiliar with the account to explain what improved, what remains uncertain and what action is proposed. If they infer causation that the evidence does not support, revise the wording or chart layout.
Check the report at its actual sharing destination. Links, footnotes and date labels can disappear or become unreadable in exports. A report is only as useful as the version the client receives.
Compare cost by the whole reporting cycle
Request pricing for the actual clients, dashboards, users, data sources and required add-ons. For native AI tracking, include prompt or collection allowances separately from report presentation. Confirm retention and export access.
Measure time spent preparing data, checking calculations, writing commentary and correcting errors. Automation is valuable when it removes repeated work without removing the context the client needs.
Avoid paying for duplicate measurement merely to populate a dashboard. If a current source already provides suitable evidence, test whether a linked appendix or supported import is enough. If you change measurement providers, document the break in comparability.
Give the client a decision, not a victory narrative
A useful report can say that visibility was stable, a correction is now live, and revenue attribution remains uncertain. It can still recommend a concrete next step based on the evidence.
Parse can supply a separate workflow for investigating monitored answers and source evidence; this guide does not claim a native integration with every reporting tool. Our AI referral analytics guide explains the downstream measurement limits.
For the work behind the report, our content refresh guide explains how to document and verify a focused correction.
Bring the client decision the report should support, then choose the lightest reporting system that preserves the evidence.