Best survey tools for original industry research
Compare Typeform, SurveyMonkey and Alchemer for original industry research, with checks for survey logic, respondent quality, exports and methodology.
Choose Typeform when a clear respondent experience is central to a relatively focused questionnaire. Evaluate SurveyMonkey when you want a broad survey workflow and need to inspect recruitment or response-quality options. Consider Alchemer when complex logic, customization and operational integration matter. The software can help collect answers; it cannot make an unrepresentative sample representative.
Original research becomes useful when readers can understand who answered, what they were asked and how the findings were calculated. A chart without that context is difficult to trust, even when it looks polished.
Which survey tool fits the study?
The best choice depends on the questionnaire and recruitment plan. Build those before comparing subscription tiers.
| Tool | Strongest starting fit | Capability to inspect | Main risk to manage |
|---|---|---|---|
| Typeform | A focused, carefully presented questionnaire | Respondent experience and usable response exports | Attractive presentation can conceal weak questions |
| SurveyMonkey | A broad survey and research workflow | Collection, analysis and response-quality options | Quality features have eligibility and coverage limits |
| Alchemer | More complex logic and customized workflows | Branching, question types and data handling | Configuration errors can distort who answers what |
| Existing form plus analyst | A small, simple exploratory study | Reliable collection and transparent analysis | More manual validation and cleanup |
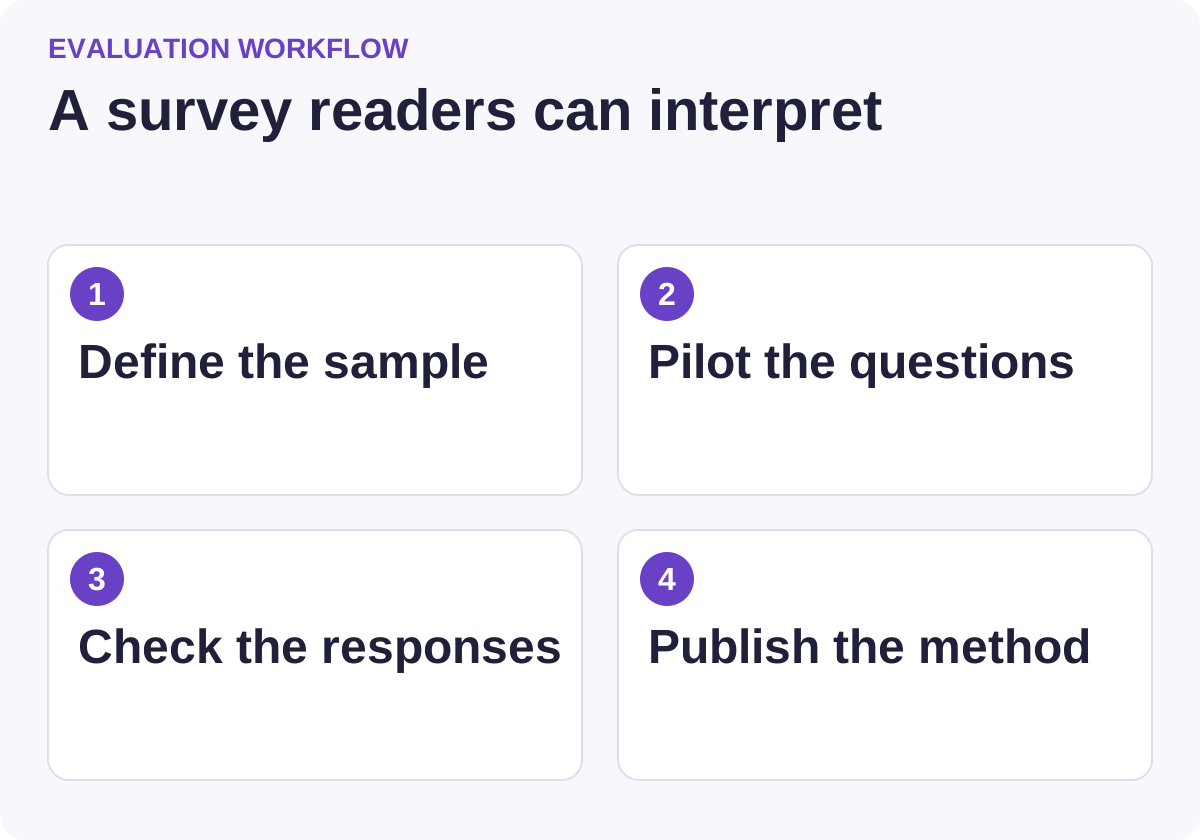
Use this workflow to compare candidates against the same requirements.
Typeform: evaluate the experience and the exported data
Typeform is a form-building platform worth considering when the questionnaire should feel clear and approachable. Its export documentation describes CSV and XLSX response exports, including the effect of selections and filters.
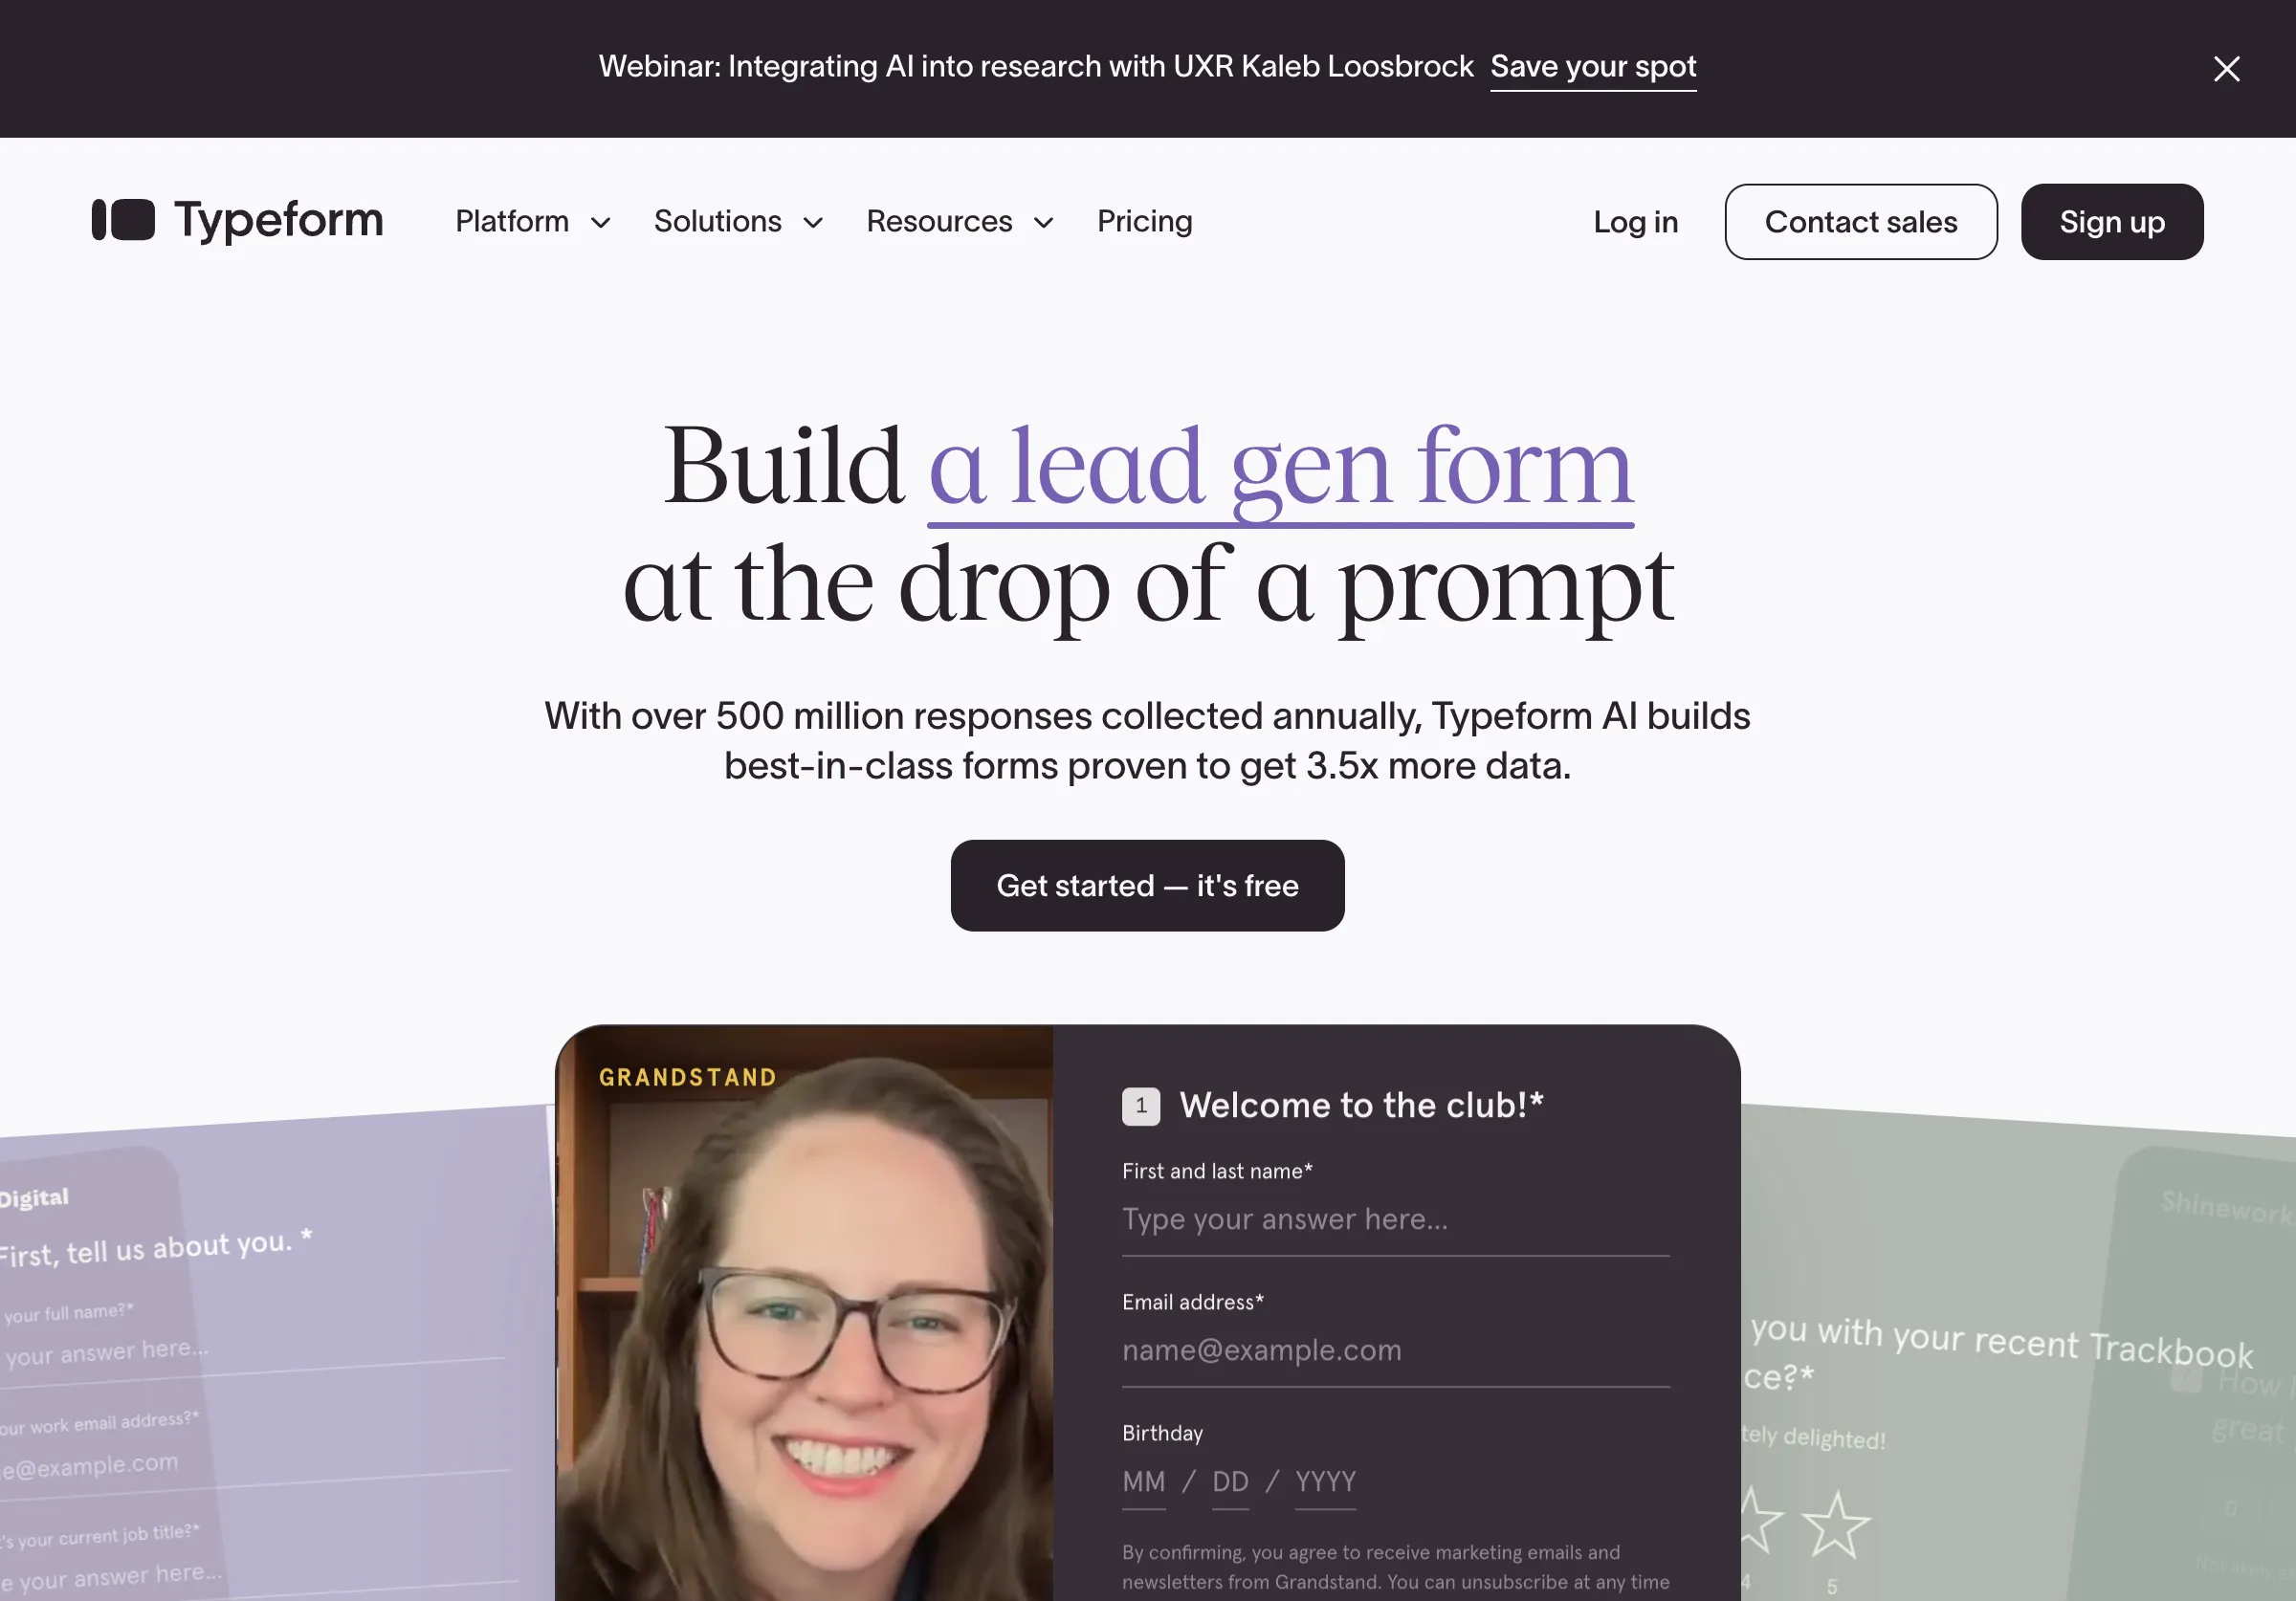
Public source page, captured November 2, 2026.
Choose it when the questionnaire is focused and your team values the respondent-facing presentation. Do not choose it solely because the form looks engaging. A confusing scale or leading question remains a research problem in any interface.
In a trial, complete the form on a phone and a desktop, then inspect the export before recruiting anyone. Check how multiple selections, unanswered questions, branching and partial responses are represented. A researcher should be able to reconstruct the denominator for every chart.
Confirm response allowances and the features needed for your design. If the analysis requires a particular export or integration, test that exact path on the intended plan rather than relying on a product overview.
SurveyMonkey: inspect the research workflow and its limits
SurveyMonkey presents survey creation, analysis and research-panel options in a broad product lineup. It is a useful candidate when the team wants more of the research process in one place.
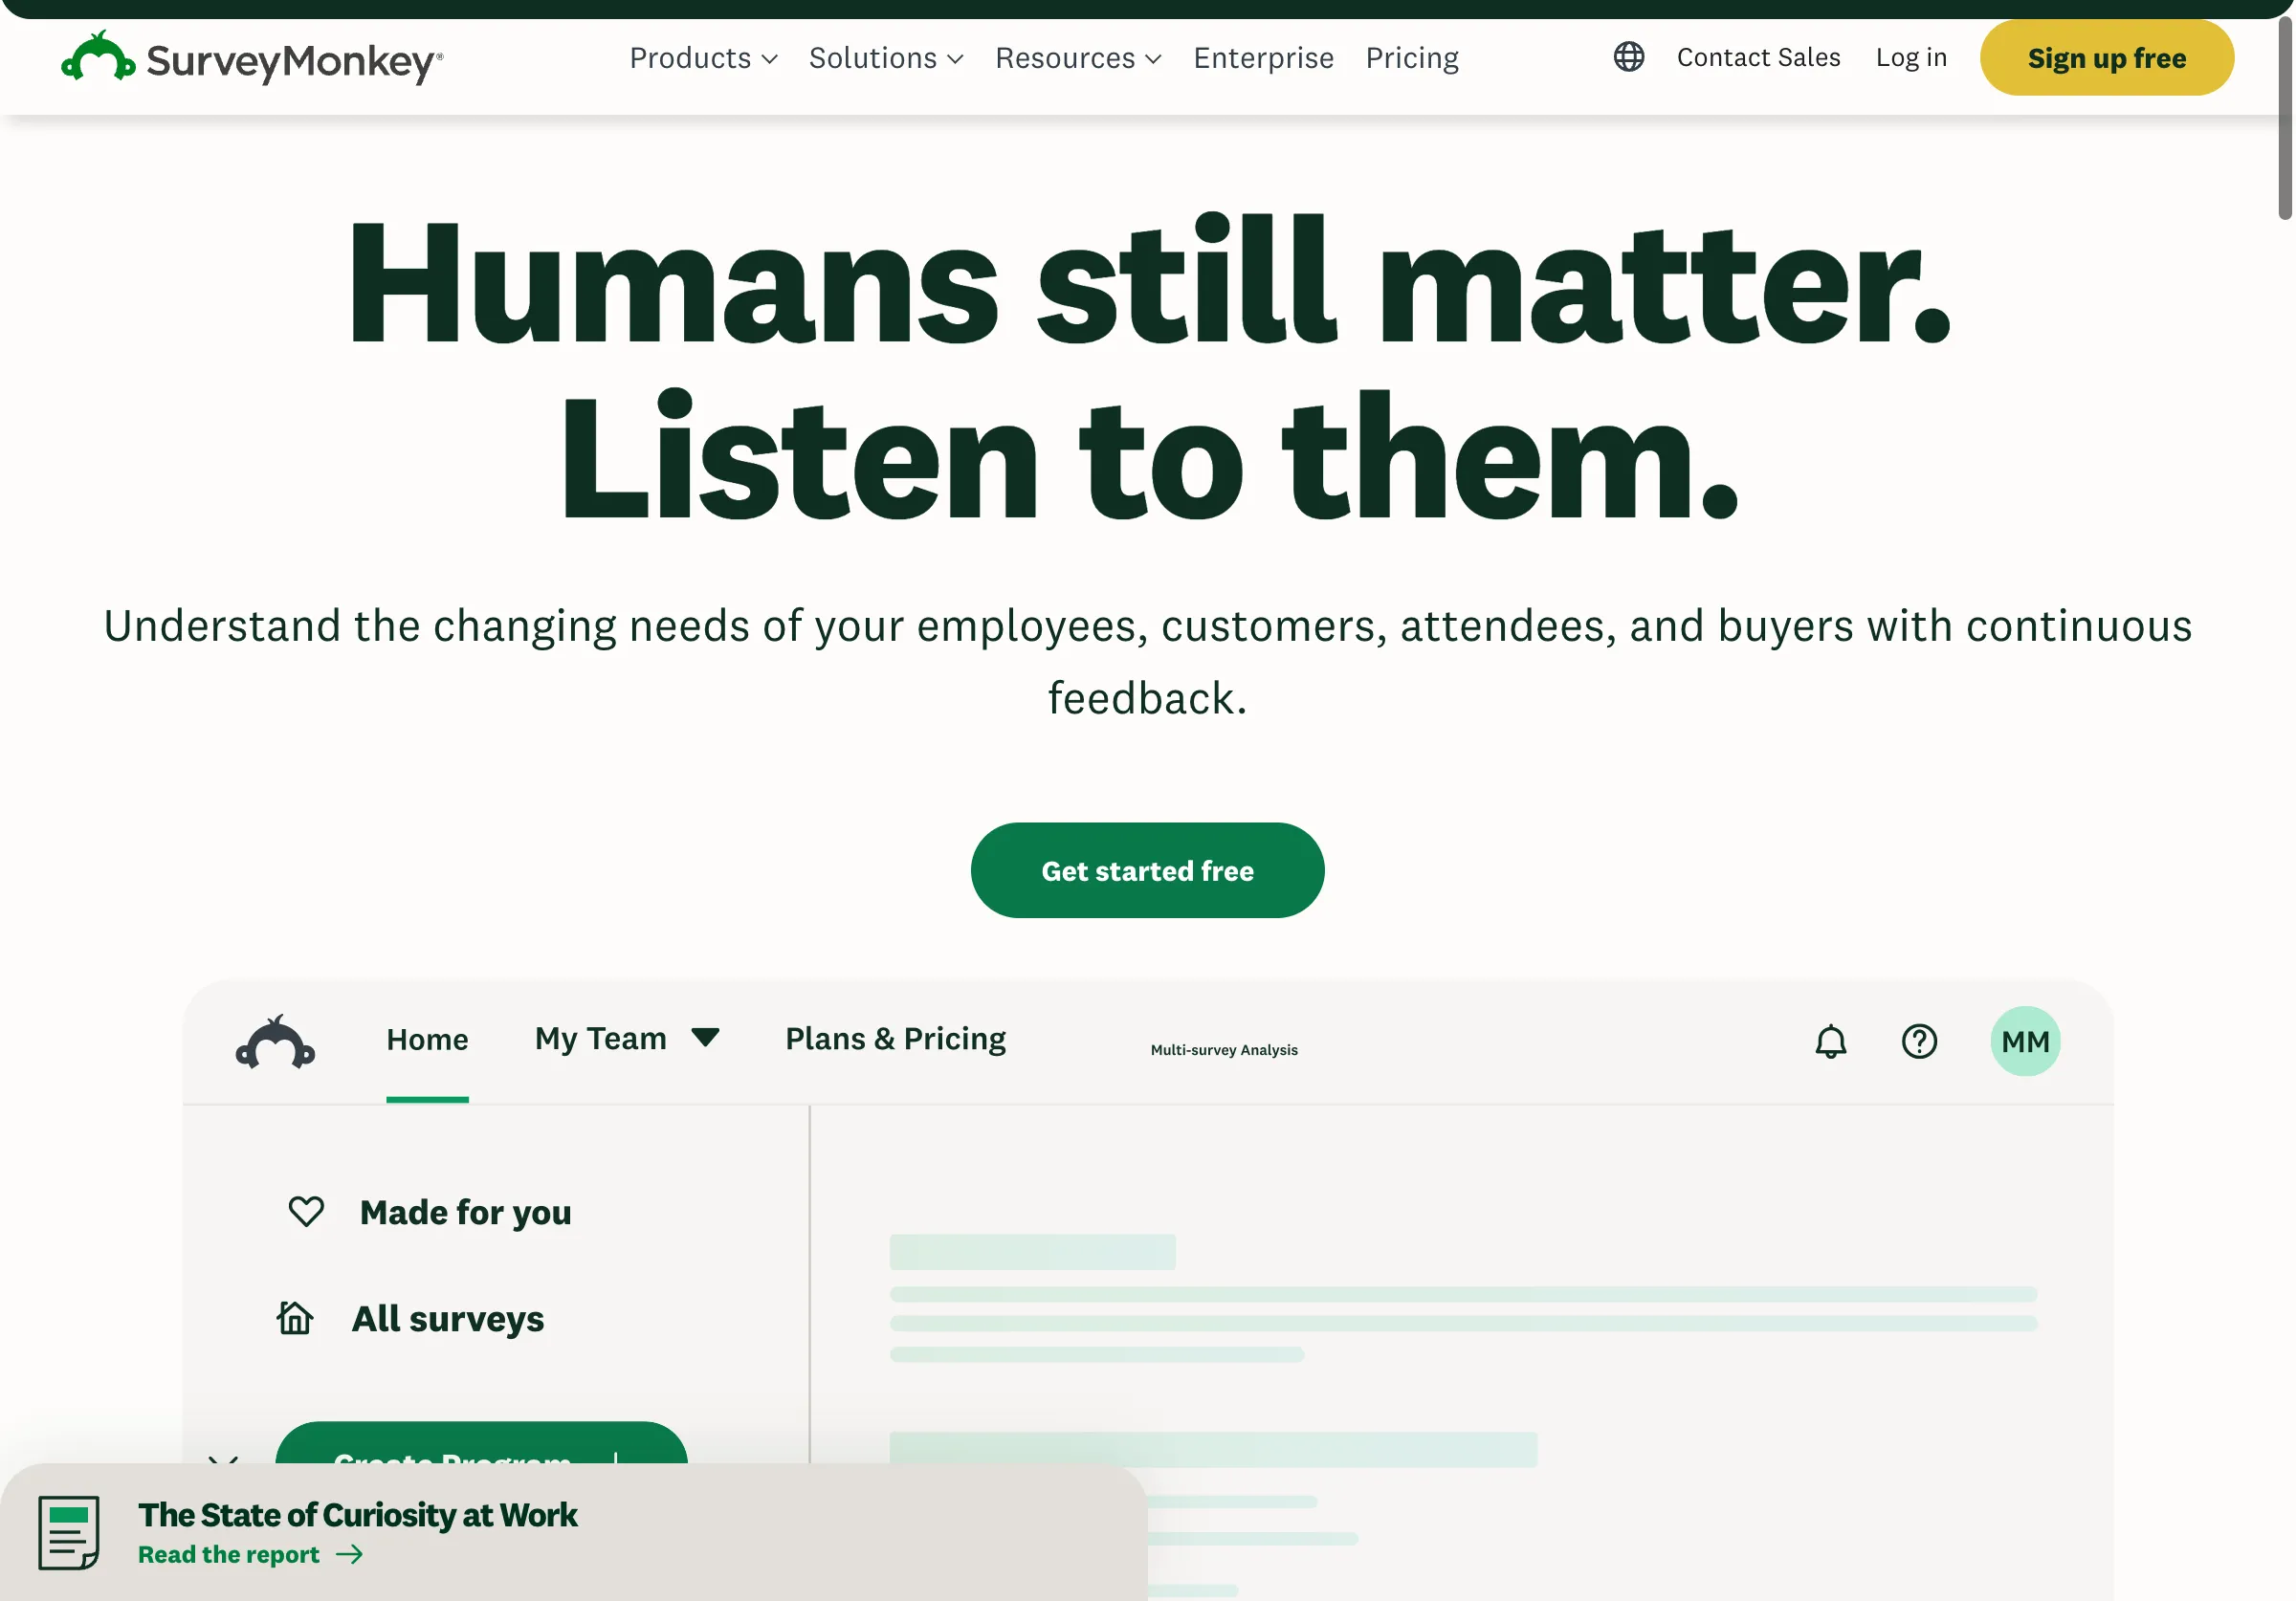
Public source page, captured November 2, 2026.
Choose it when those collection and analysis capabilities match the study. Do not assume buying panel responses guarantees that the sample represents your industry, or that automated quality flags identify every poor response.
Its response-quality documentation describes flags such as speeding, straight-lining and gibberish. It also documents limitations: the feature requires complete English-language responses and is unavailable in specified situations, including Canada or EU data-center storage. Check the current requirements for your account.
Use flags as review inputs, not an excuse to remove answers you dislike. Define exclusion rules before examining the result you hope to publish, and retain a record of exclusions. A fast response can be legitimate; a plausible-looking answer can still be low quality.
Alchemer: evaluate logic with realistic edge cases
Alchemer Survey describes customization, logic and branching, multiple question types and reporting. It is a relevant candidate when the questionnaire has several respondent paths or must connect to a more involved operational process.
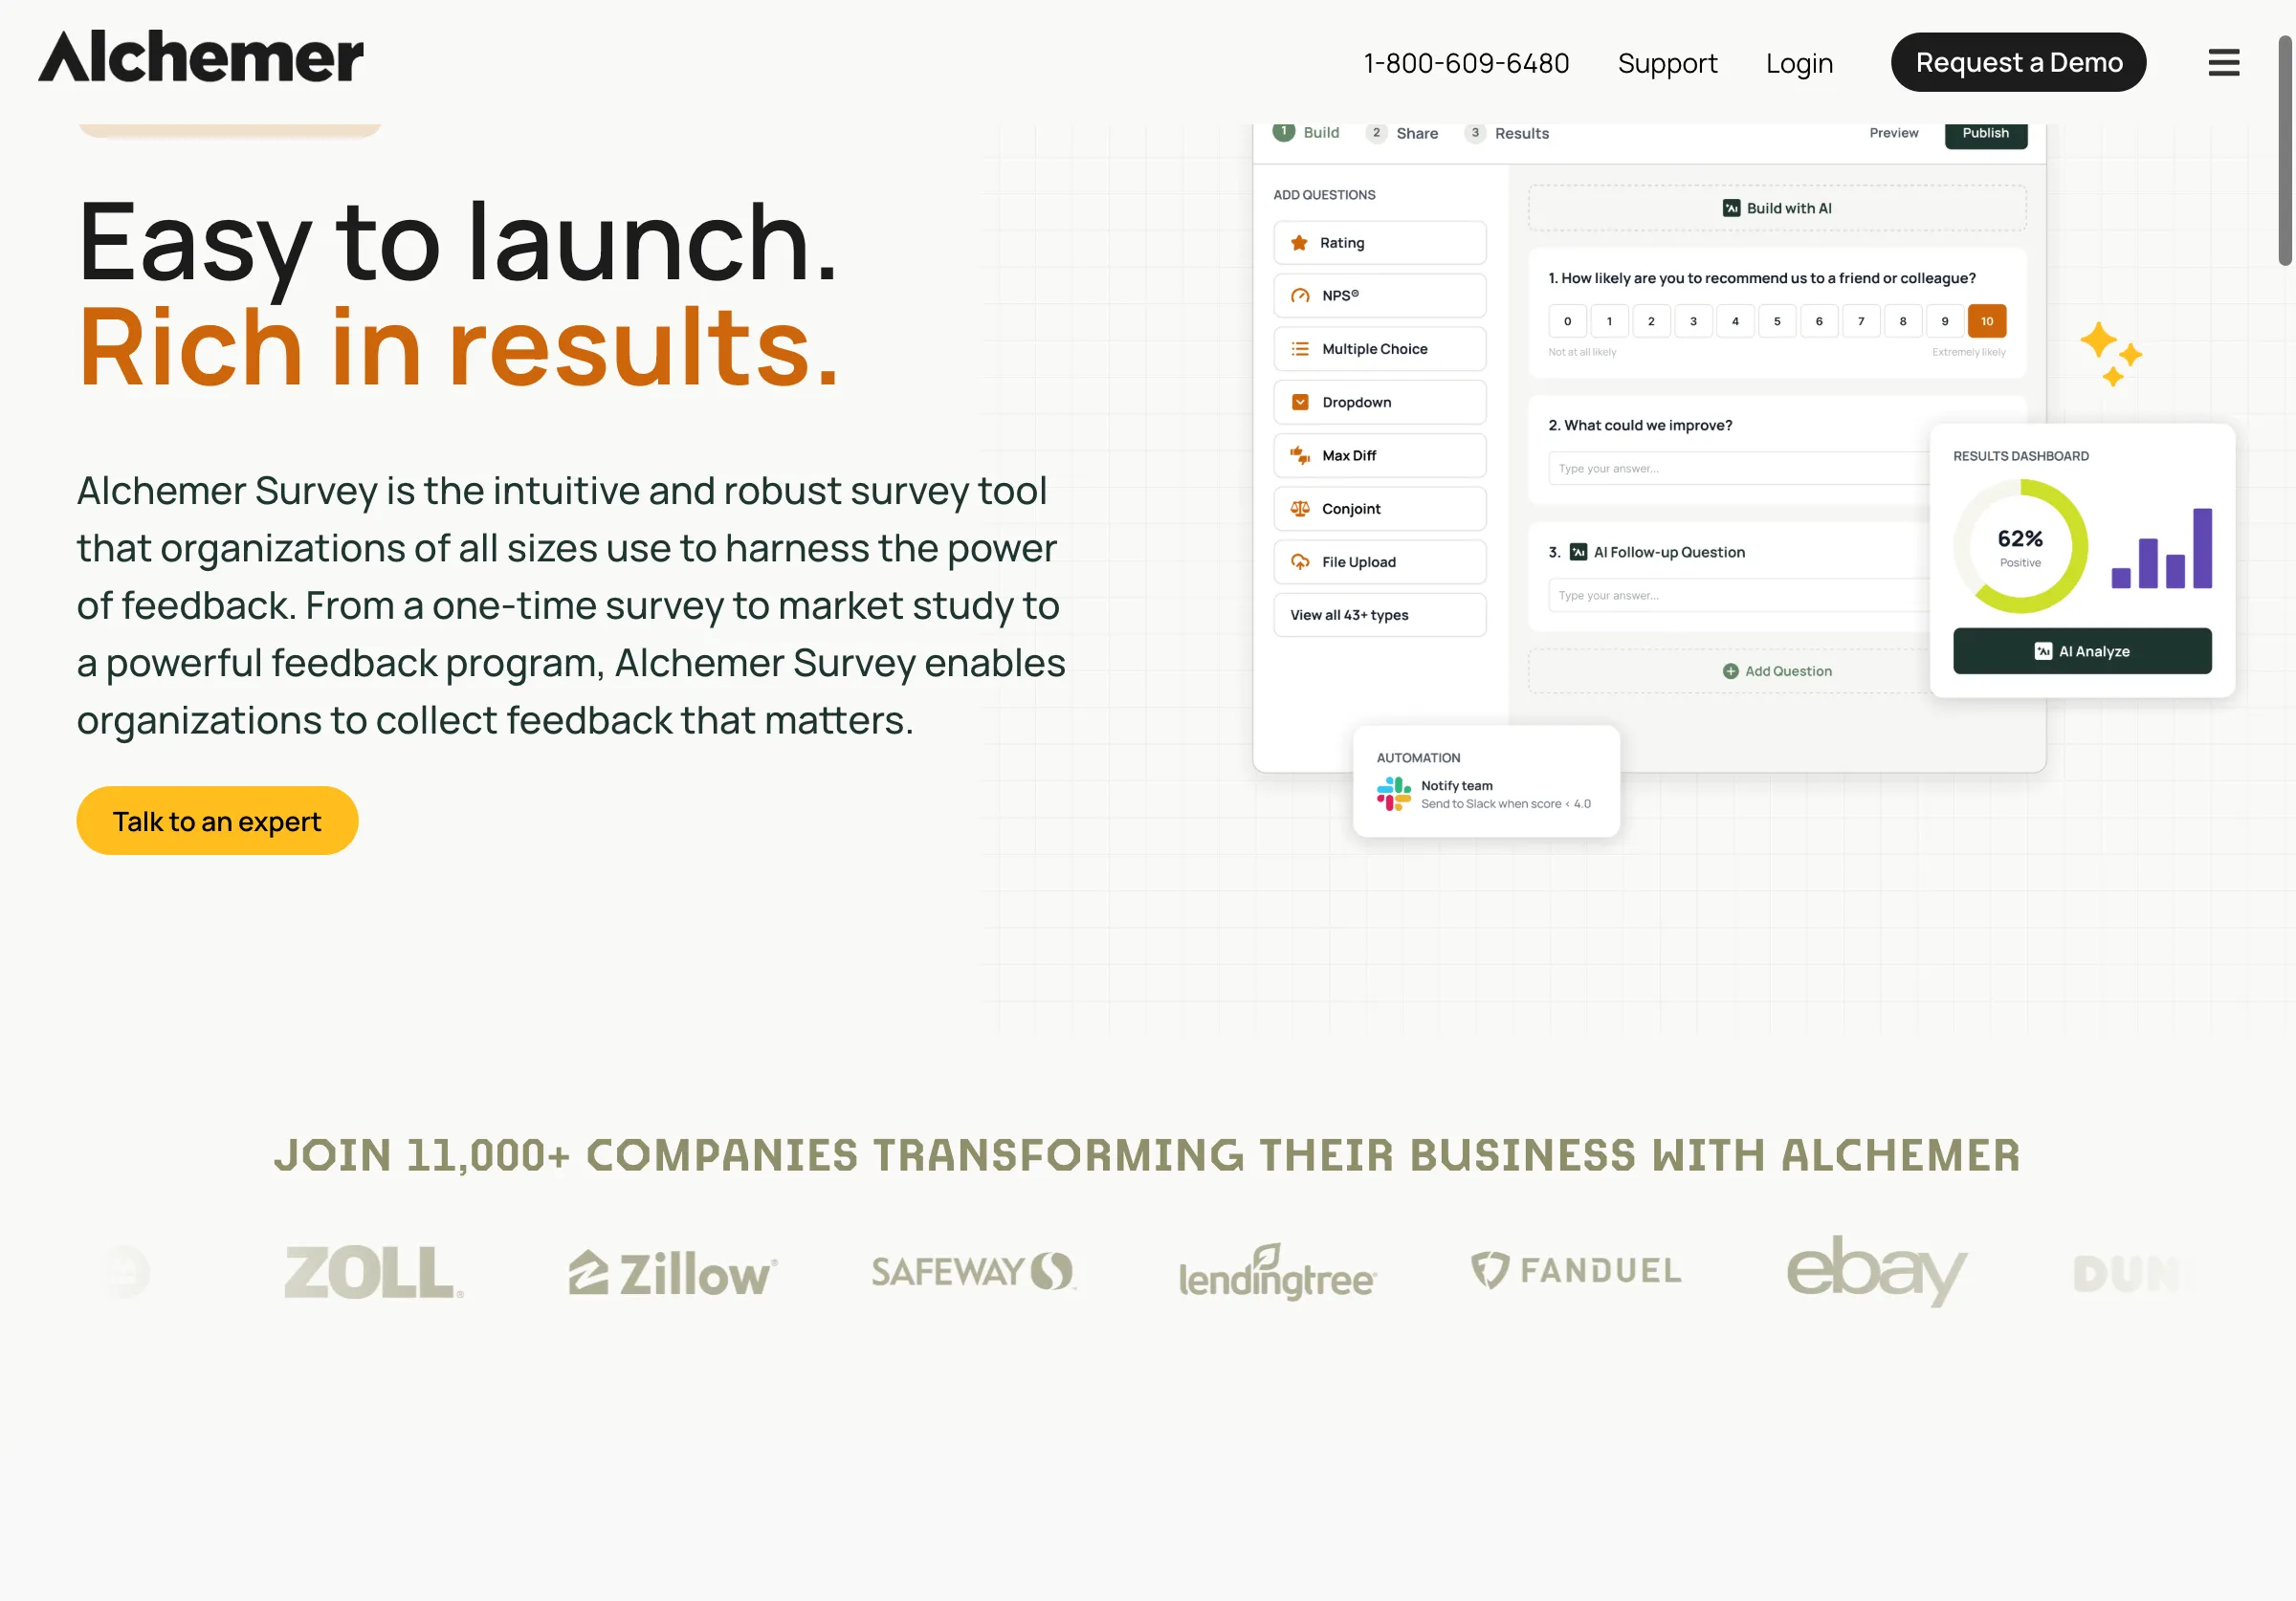
Public source page, captured November 2, 2026.
Choose it when the complexity is justified by the research question and someone can maintain the survey design. Do not add branching simply because the tool supports it. Every branch changes which respondents see which questions and therefore how results should be interpreted.
Build a test matrix before launch. Include an eligible respondent, an ineligible respondent, someone selecting “other,” someone declining a sensitive question and someone changing an earlier answer. Check that each reaches the intended questions and ending.
Ask about exports, access controls, integration requirements and the plan that supports the required logic. The cheapest tier is not a meaningful comparison if it cannot run the approved questionnaire.
Start with a study brief, not a chart idea
Write the decision or knowledge gap in one sentence. For example: “We want to understand which steps delay approval of technical B2B content among the teams we can recruit.” That is narrower and more defensible than claiming to measure the entire industry's productivity.
Define the population, eligibility rules, recruitment channels and intended reporting scope. If respondents come from your customer list and social following, describe the study as that sample. Do not imply a random sample of all companies.
Specify how you will handle incomplete responses, duplicates, low-quality answers and small subgroups. Decide which questions are essential and which are exploratory. This makes it harder to reshape the methodology around a surprising result after collection.
Use the same questionnaire to evaluate all three tools
The following is an illustrative pilot design. It contains no collected responses or industry findings.
| Question type | Purpose | Test before launch |
|---|---|---|
| Eligibility | Confirm the respondent works on the relevant process | Ineligible respondents exit correctly |
| Recent behavior | Ask about the last completed project | Wording has a clear time frame |
| Multiple selection | Identify stages involved | Export preserves every selected option |
| Single-choice bottleneck | Identify the biggest reported delay | Options are distinct and include an appropriate fallback |
| Numeric response | Capture a bounded estimate | Units and allowed values are clear |
| Open text | Learn what fixed options missed | Personal or confidential information is discouraged |
| Optional attribution | Obtain explicit permission for a quotation | Permission is separate from answering the survey |
Ask a few people similar to the intended respondents to explain what they think each question means. This is a comprehension pilot, not the final study. Revise confusing wording before collecting data you intend to publish.
Keep the final questionnaire version. If you change a consequential question during collection, record the change and assess whether the responses can still be combined.
Protect the denominator
Every percentage needs a clear base. If 40 people complete the survey but only 18 answer a question shown to managers, the denominator for that question is not automatically 40. If respondents can choose several options, percentages may legitimately sum to more than 100 percent.
Export the data and independently reproduce at least the headline calculations. Check missing values, duplicate rows and labels. Preserve raw data in a restricted location and create a separate analysis copy with documented transformations.
Avoid publishing small subgroup comparisons that imply precision the sample cannot support. Describe exploratory patterns as exploratory. A striking difference between two tiny groups may be a useful interview question rather than a publishable market conclusion.
Publish a methodology readers can inspect
Include the collection dates, sample size, recruitment method, eligibility, relevant geography, questionnaire wording, exclusion rules and the base for each major chart. Explain whether the sample was weighted and why, if applicable.
Distinguish anonymous collection from merely omitting names in the article. If contact information was collected for follow-up, explain that accurately to participants. Obtain permission before attributing a quotation and avoid releasing raw responses that could identify someone indirectly.
The public article should connect each headline to a result the reader can understand. A useful appendix can contain the questionnaire, definitions and an aggregated results table. You do not need to expose private respondent data to make the method transparent.
Compare the cost of an interpretable study
Budget software, recruitment, pilot testing, analysis, editing and visual production. Ask about response caps, overages, team access, exports and panel costs separately. A free form does not make recruitment or analysis free.
The strongest evaluation is a small pilot through the entire workflow: create, complete, export, clean, calculate and explain. If the team cannot reproduce a simple result from the export, resolve that before expanding the sample.
Before writing the questionnaire, our audience research guide can help clarify whose experience the study should investigate.
Start with a question your audience actually needs answered and a method you can describe honestly.